-
-
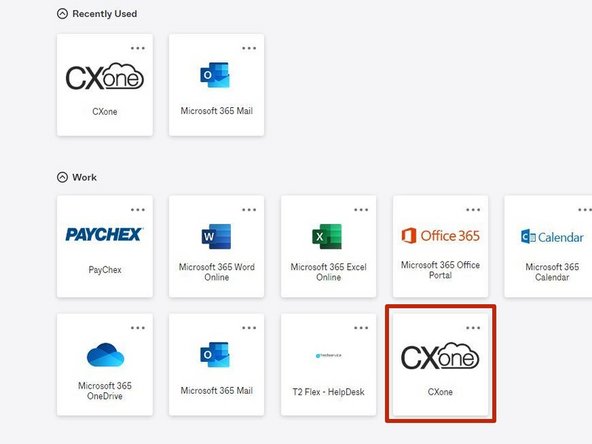
While viewing your T2 Dashboard:
-
Click CXone
-
-
-
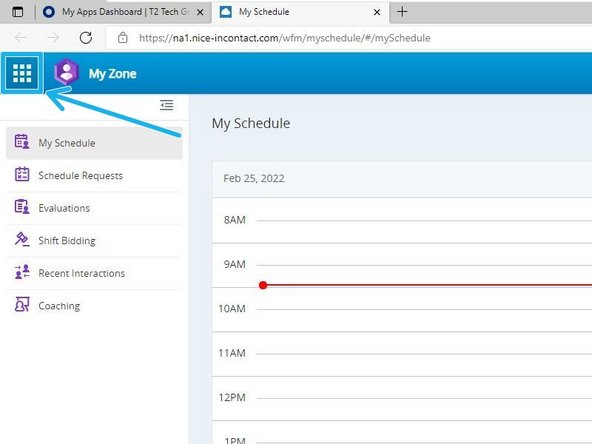
Click the Dial pad icon
-
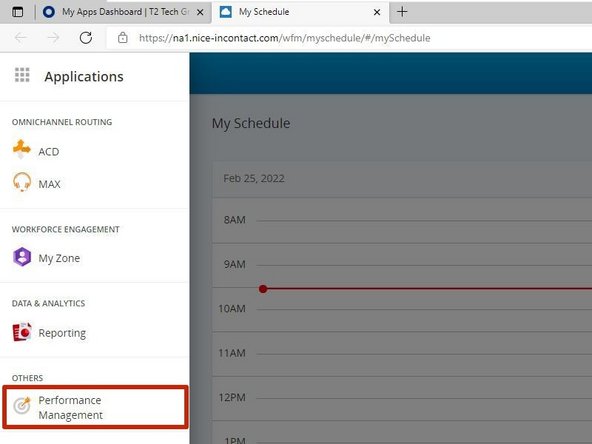
Click Performance Management
-
-
-
Click Existing
-
-
-
Click Agent Dashboard
-
-
-
Your agent dashboard will appear.
-
CPH: Calls Per Hour
-
Average Handle Time
-
Working Rate: (Handle Time + Available Time) ÷ Time Logged In
-
ACW: After Call Work
-
Agents highlighted in green are meeting or exceeding the KPI.
-
Agents highlighted in red are failing to meet the KPI.
-


Almost done!
Finish Line